27, FFORDD SIARL, ST. ASAPH, LL17 0PT - £128,000
Based on the January 2025 Price Paid Data (released on 3rd March 2025), the December 2024 House Price Index (released on 19th February 2025), and the January 2025 Energy Performance of Buildings Data (released on 27th February 2025). Sources
27 FFORDD SIARL is a very small detached house of 69m², built sometime between 1950 and 1966. It was last sold for £128,000 in August 2004, which was around 19% below the average August 2004 detached price in the Denbighshire local authority area. The most recent EPC inspection was March 2011, where the current energy rating was B, and the potential energy rating was B.
27 FFORDD SIARL Sold Prices
Land registry data shows two sales for 27 FFORDD SIARL since 1st January 1995. The below table shows the price paid for the two sales, along with the average detached price in the Denbighshire local authority area for the corresponding sale date. Both of the two 27 FFORDD SIARL sales were for below the average price. The average price is sourced from the Office for National Statistics' House Price Index (HPI).
| Date | Price | HPI Price | Variation from HPI |
|---|---|---|---|
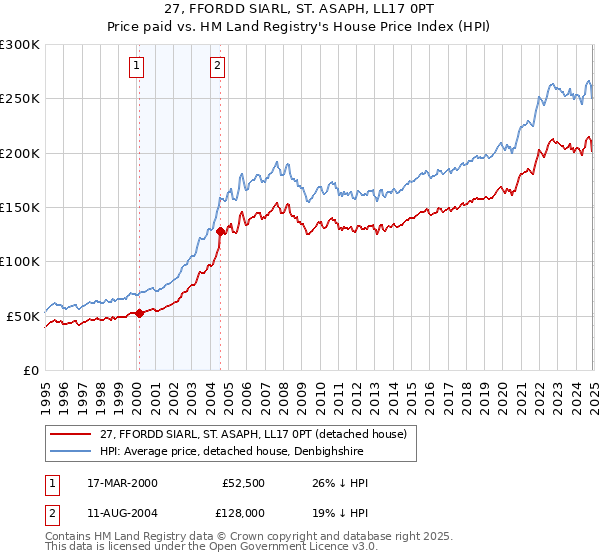
2004 11 AUG | £128,000 | £158,794 | 19% below HPI |
2000 17 MAR | £52,500 | £70,570 | 26% below HPI |
27 FFORDD SIARL Price Paid vs. HPI Average
The below graph shows the average detached house price in the Denbighshire local authority area over time, sourced from the HPI. The two 27 FFORDD SIARL sales from March 2000 and August 2004 have been plotted on the graph. A line has been extrapolated to show what the value of the property might have been over time, following each sale, had it maintained the same margin above or below the HPI (as a percentage). For example, the March 2000 sale was for 26% below the HPI. So the extrapolation line tracks at 26% below the HPI over time, until the August 2004 sale, where it rises to 19% below the HPI. The line then continues to track at 19% below the HPI.
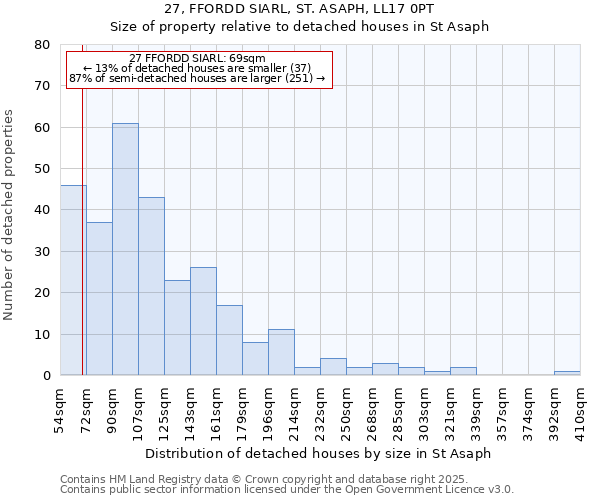
How Large is 27 FFORDD SIARL?
27 FFORDD SIARL is 69m² according to the EPC inspection conducted in March 2011. This puts it in the smallest 20% of detached houses houses in St Asaph, based on EPC data. The below chart shows the distribution of detached houses houses by size in St Asaph, and where 27 FFORDD SIARL lies on this distribution: 13% of detached houses houses are smaller than 27 FFORDD SIARL, and 87% of houses are larger. Note that EPC data is not available for all properties in St Asaph.
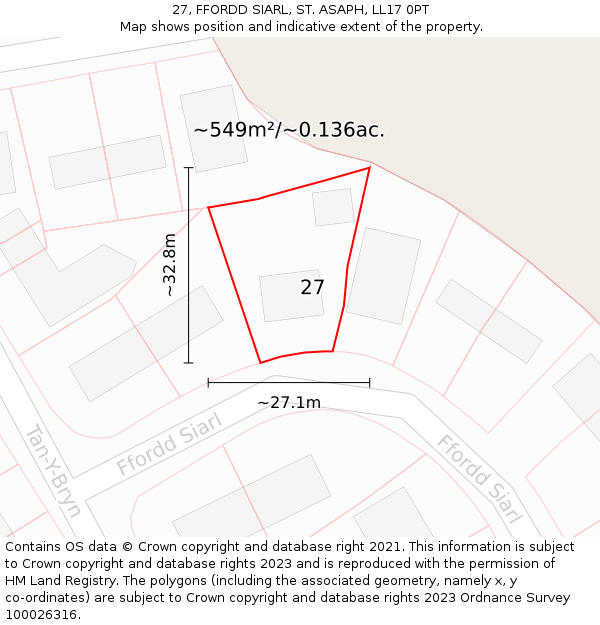
27 FFORDD SIARL: Plot and Title Map
27 FFORDD SIARL sits on a plot of roughly 0.136 of an acre, or 549m². The below map shows the location of 27 FFORDD SIARL, an approximate outline of the building(s), and the indicative extent of the property. The plot extent is a Land Registry INSPIRE Index Polygon, and it is important to note that a title may include more than one polygon, whereas only one polygon is shown on the map (the polygon which intersects with the position of 27 FFORDD SIARL). The full extent of the land contained in any registered title can only be identified from the individual title plan. The maps on this page should not be relied upon to establish the extent of a title.
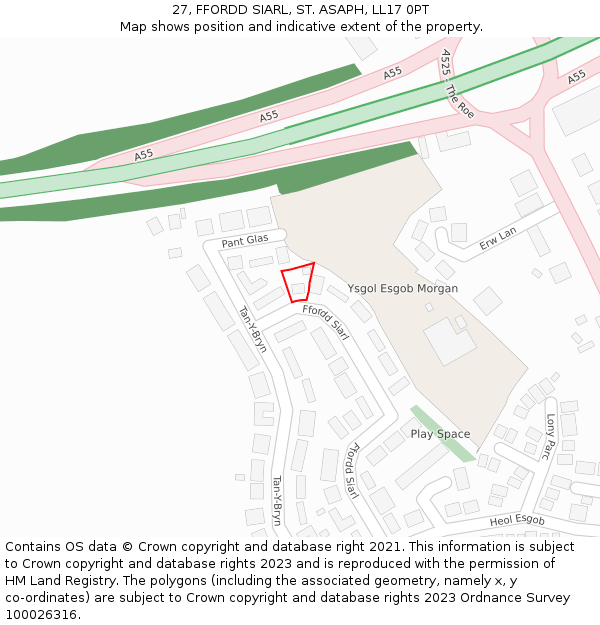
Where is 27 FFORDD SIARL?
27 FFORDD SIARL is located in ST. ASAPH, in the LL17 postcode district. The below map shows the position of No. 27 on FFORDD SIARL.
All property sales on FFORDD SIARL
Most recent sales first:
- Contains OS data © Crown copyright and database right (2025)
- Contains Royal Mail data © Royal Mail copyright and Database right (2025)
- Contains National Statistics data © Crown copyright and database right (2025)
- Data produced by Land Registry © Crown copyright (2025)
- Contains Environment Agency data licensed under the Open Government Licence v3.0
- Everything else © GetTheData Publishing Limited (2025)
GetTheData.com is owned and operated by GetTheData Publishing Limited.
Company Number: 11075184 · Registered in England and Wales.
Registered Office: Advantage, 87 Castle Street, Reading, Berkshire, England, RG1 7SN
By accessing our site you agree to us using cookies, and sharing information about your use of our site, in accordance with our privacy policy.