25, HAILEYBURY ROAD, WEST BRIDGFORD, NOTTINGHAM, NG2 7BE - £420,000
Based on the January 2025 Price Paid Data (released on 3rd March 2025), the December 2024 House Price Index (released on 19th February 2025), and the January 2025 Energy Performance of Buildings Data (released on 27th February 2025). Sources
25 HAILEYBURY ROAD is a midsized extended detached house of 122m², built sometime between 1930 and 1949. It was last sold for £420,000 in February 2019, which was around 13% above the average February 2019 detached price in the Rushcliffe local authority area. The most recent EPC inspection was September 2018, where the current energy rating was D, and the potential energy rating was B.
25 HAILEYBURY ROAD Sold Prices
Land registry data shows four sales for 25 HAILEYBURY ROAD since 1st January 1995. The below table shows the price paid for the four sales, along with the average detached price in the Rushcliffe local authority area for the corresponding sale date. Most of the four 25 HAILEYBURY ROAD sales were for below the average price. The average price is sourced from the Office for National Statistics' House Price Index (HPI).
| Date | Price | HPI Price | Variation from HPI |
|---|---|---|---|
2019 15 FEB | £420,000 | £372,783 | 13% above HPI |
2008 24 OCT | £205,000 | £259,764 | 21% below HPI |
2004 8 APR | £215,000 | £239,995 | 10% below HPI |
2001 12 OCT | £140,000 | £159,077 | 12% below HPI |
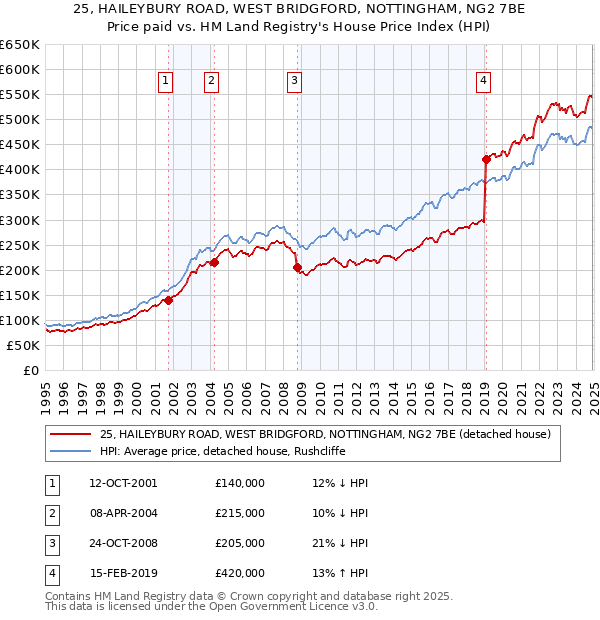
25 HAILEYBURY ROAD Price Paid vs. HPI Average
The below graph shows the average detached house price in the Rushcliffe local authority area over time, sourced from the HPI. The four 25 HAILEYBURY ROAD sales between October 2001 and February 2019 have been plotted on the graph. A line has been extrapolated to show what the value of the property might have been over time, following each sale, had it maintained the same margin above or below the HPI (as a percentage). For example, the October 2008 sale was for 21% below the HPI. So the extrapolation line tracks at 21% below the HPI over time, until the February 2019 sale, where it rises to 13% above the HPI. The line then continues to track at 13% above the HPI.
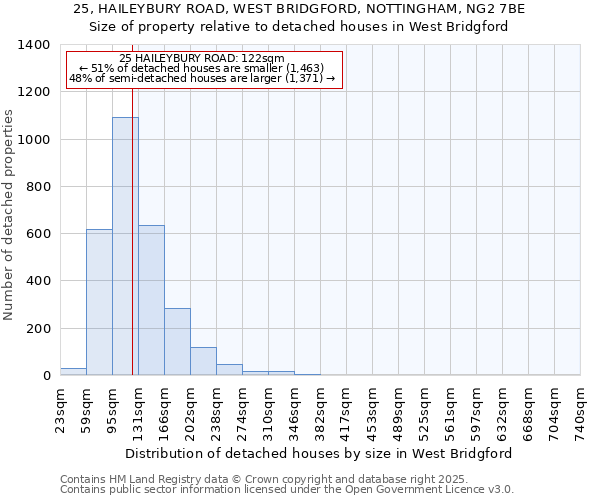
How Large is 25 HAILEYBURY ROAD?
25 HAILEYBURY ROAD is 122m², which includes one extension, according to the EPC inspection conducted in September 2018. This puts it in the largest 50% of detached houses in West Bridgford, based on EPC data. The below chart shows the distribution of detached houses by size in West Bridgford, and where 25 HAILEYBURY ROAD lies on this distribution: 51% of detached houses are smaller than 25 HAILEYBURY ROAD, and 48% of houses are larger. Note that EPC data is not available for all properties in West Bridgford.